Question 6
The pictogram shows the amount of milk Tom drank from January to April 2019. Each bottle represents 5 liters. The rows are January, February, March and April, in that order. 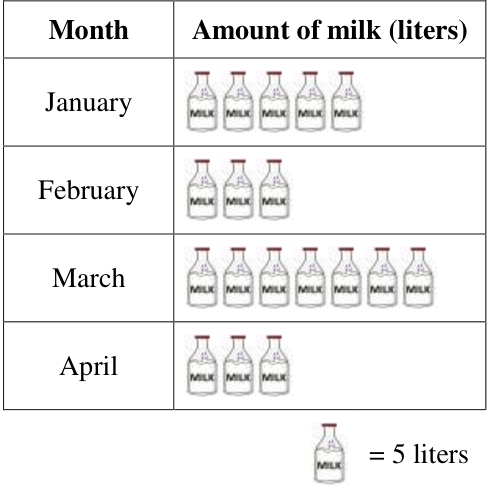
In which month did Tom drink the most milk?
In which month did Tom drink the most milk?