Question 5
The pictogram shows the amount of milk Tom drank from January to April 2019. Each bottle represents 5 liters. The rows are January, February, March and April, in that order. 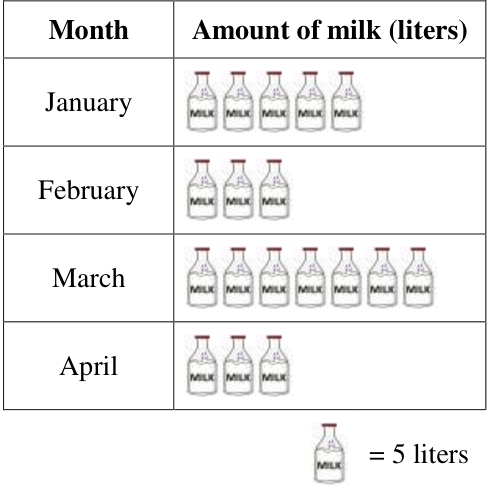
How many liters of milk did Tom drink in March and April altogether?
How many liters of milk did Tom drink in March and April altogether?