Question 13
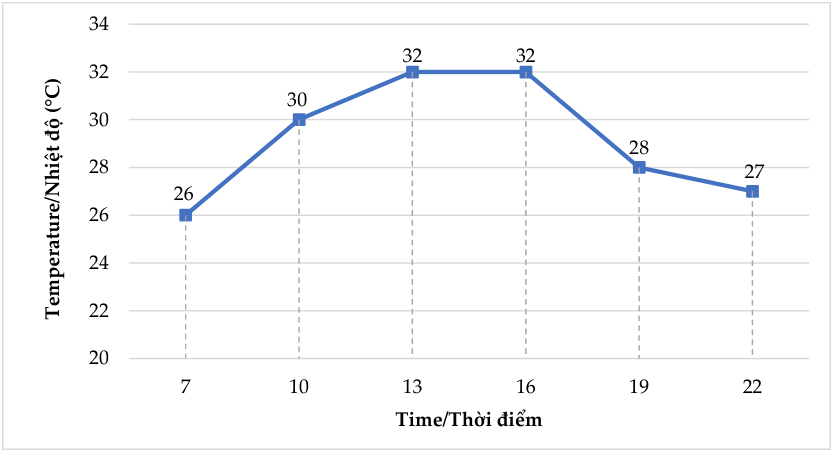
The line graph below shows the temperatures measured at different times during the day. What is the average temperature for that day, rounded to the nearest whole number (degree Celsius)?

VIAMC · VIAMC 2025 Mock Test — Level 3 (Upper Primary)