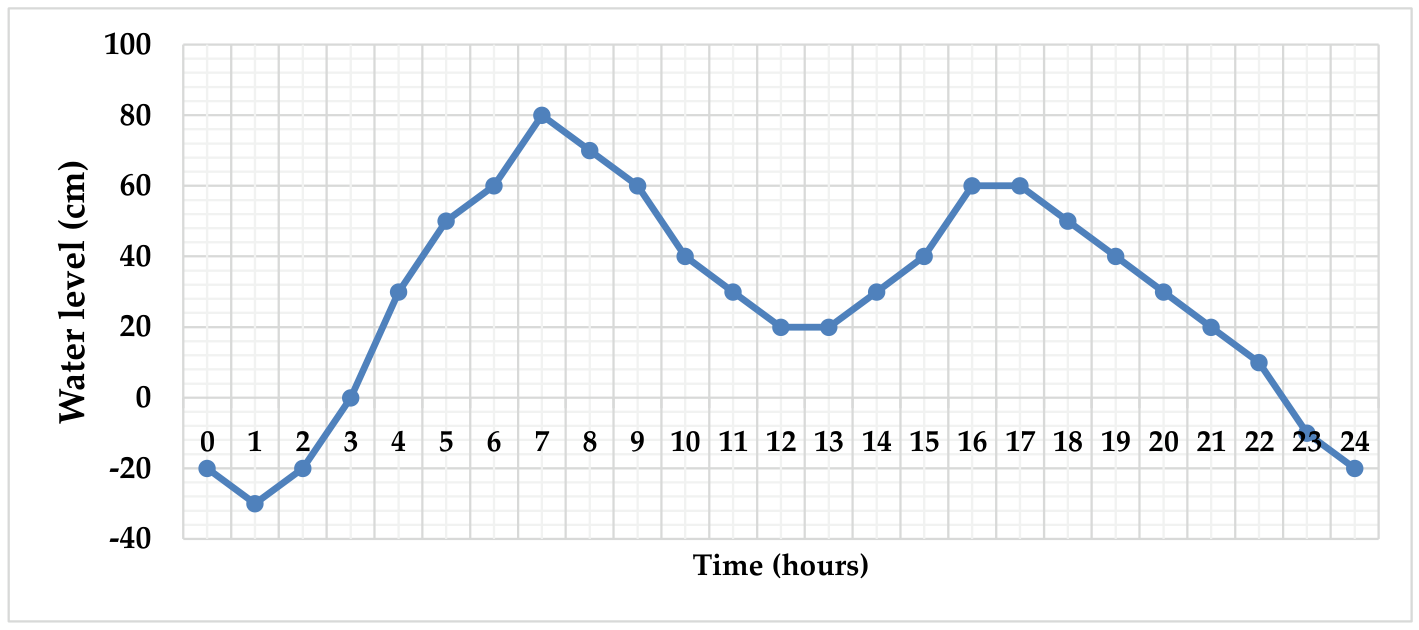
Question 11The graph shows a port city’s water level over one day. For how many hours is it above 40 cm? Axes: water level in cm, time in hours. 55.599.511