Skip to content / Đến nội dung
ThichHocToan.com

1993 AMC 8 Question 5

AMC8 · 1993 AMC 8

Question 5

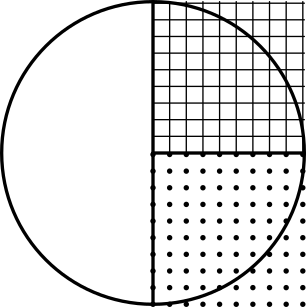
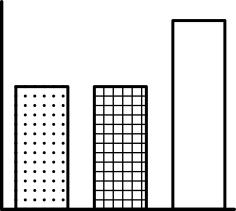
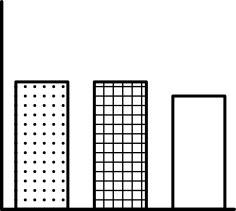
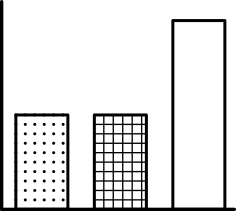
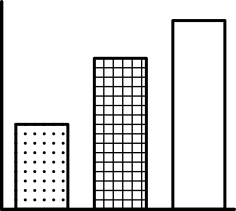
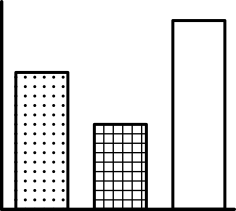
Which one of the following bar graphs could represent the data from the circle graph shown?

Question illustration

**(A)** Question illustration

**(B)** Question illustration

**(C)** Question illustration

**(D)** Question illustration

**(E)** Question illustration
  1. Choice A shown above
  2. Choice B shown above
  3. Choice C shown above
  4. Choice D shown above
  5. Choice E shown above