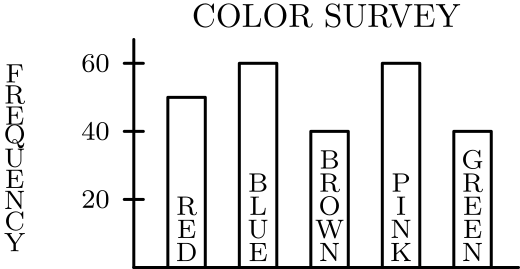
Question 11The bar graph shows the results of a survey on color preferences. From left to right, the bars represent red, blue, brown, pink, and green. What percent preferred blue? $20\%$$24\%$$30\%$$36\%$$42\%$