Question 12
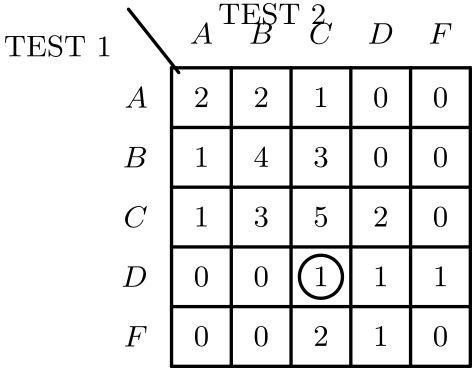
The table shown displays the grade distribution of the $30$ students in a mathematics class on the last two tests. For example, exactly one student received a ‘D’ on Test $1$ and a ‘C’ on Test $2$ (the circled entry). What percent of the students received the same grade on both tests?